Monitoring
Kube Sentinel provides comprehensive monitoring capabilities for your Kubernetes clusters through integration with Prometheus and built-in visualization tools.
Cluster Overview
The Overview page acts as a central dashboard for your cluster's health and status. It provides high-level metrics and statistics, allowing you to quickly assess the state of your infrastructure.
Key Features:
- Cluster Statistics: View total counts of Nodes, Pods, Deployments, and other key resources.
- Resource Utilization: Real-time charts showing aggregated CPU and Memory usage across the cluster (requires Prometheus).
- Network Traffic: Visualize inbound and outbound network traffic trends (requires Prometheus).
- Recent Events: A feed of the latest Kubernetes events, helping you spot errors or warnings immediately.
Resource Monitoring
In addition to cluster-wide metrics, you can monitor individual resources (like Deployments, StatefulSets, and Pods) directly from their detail pages.
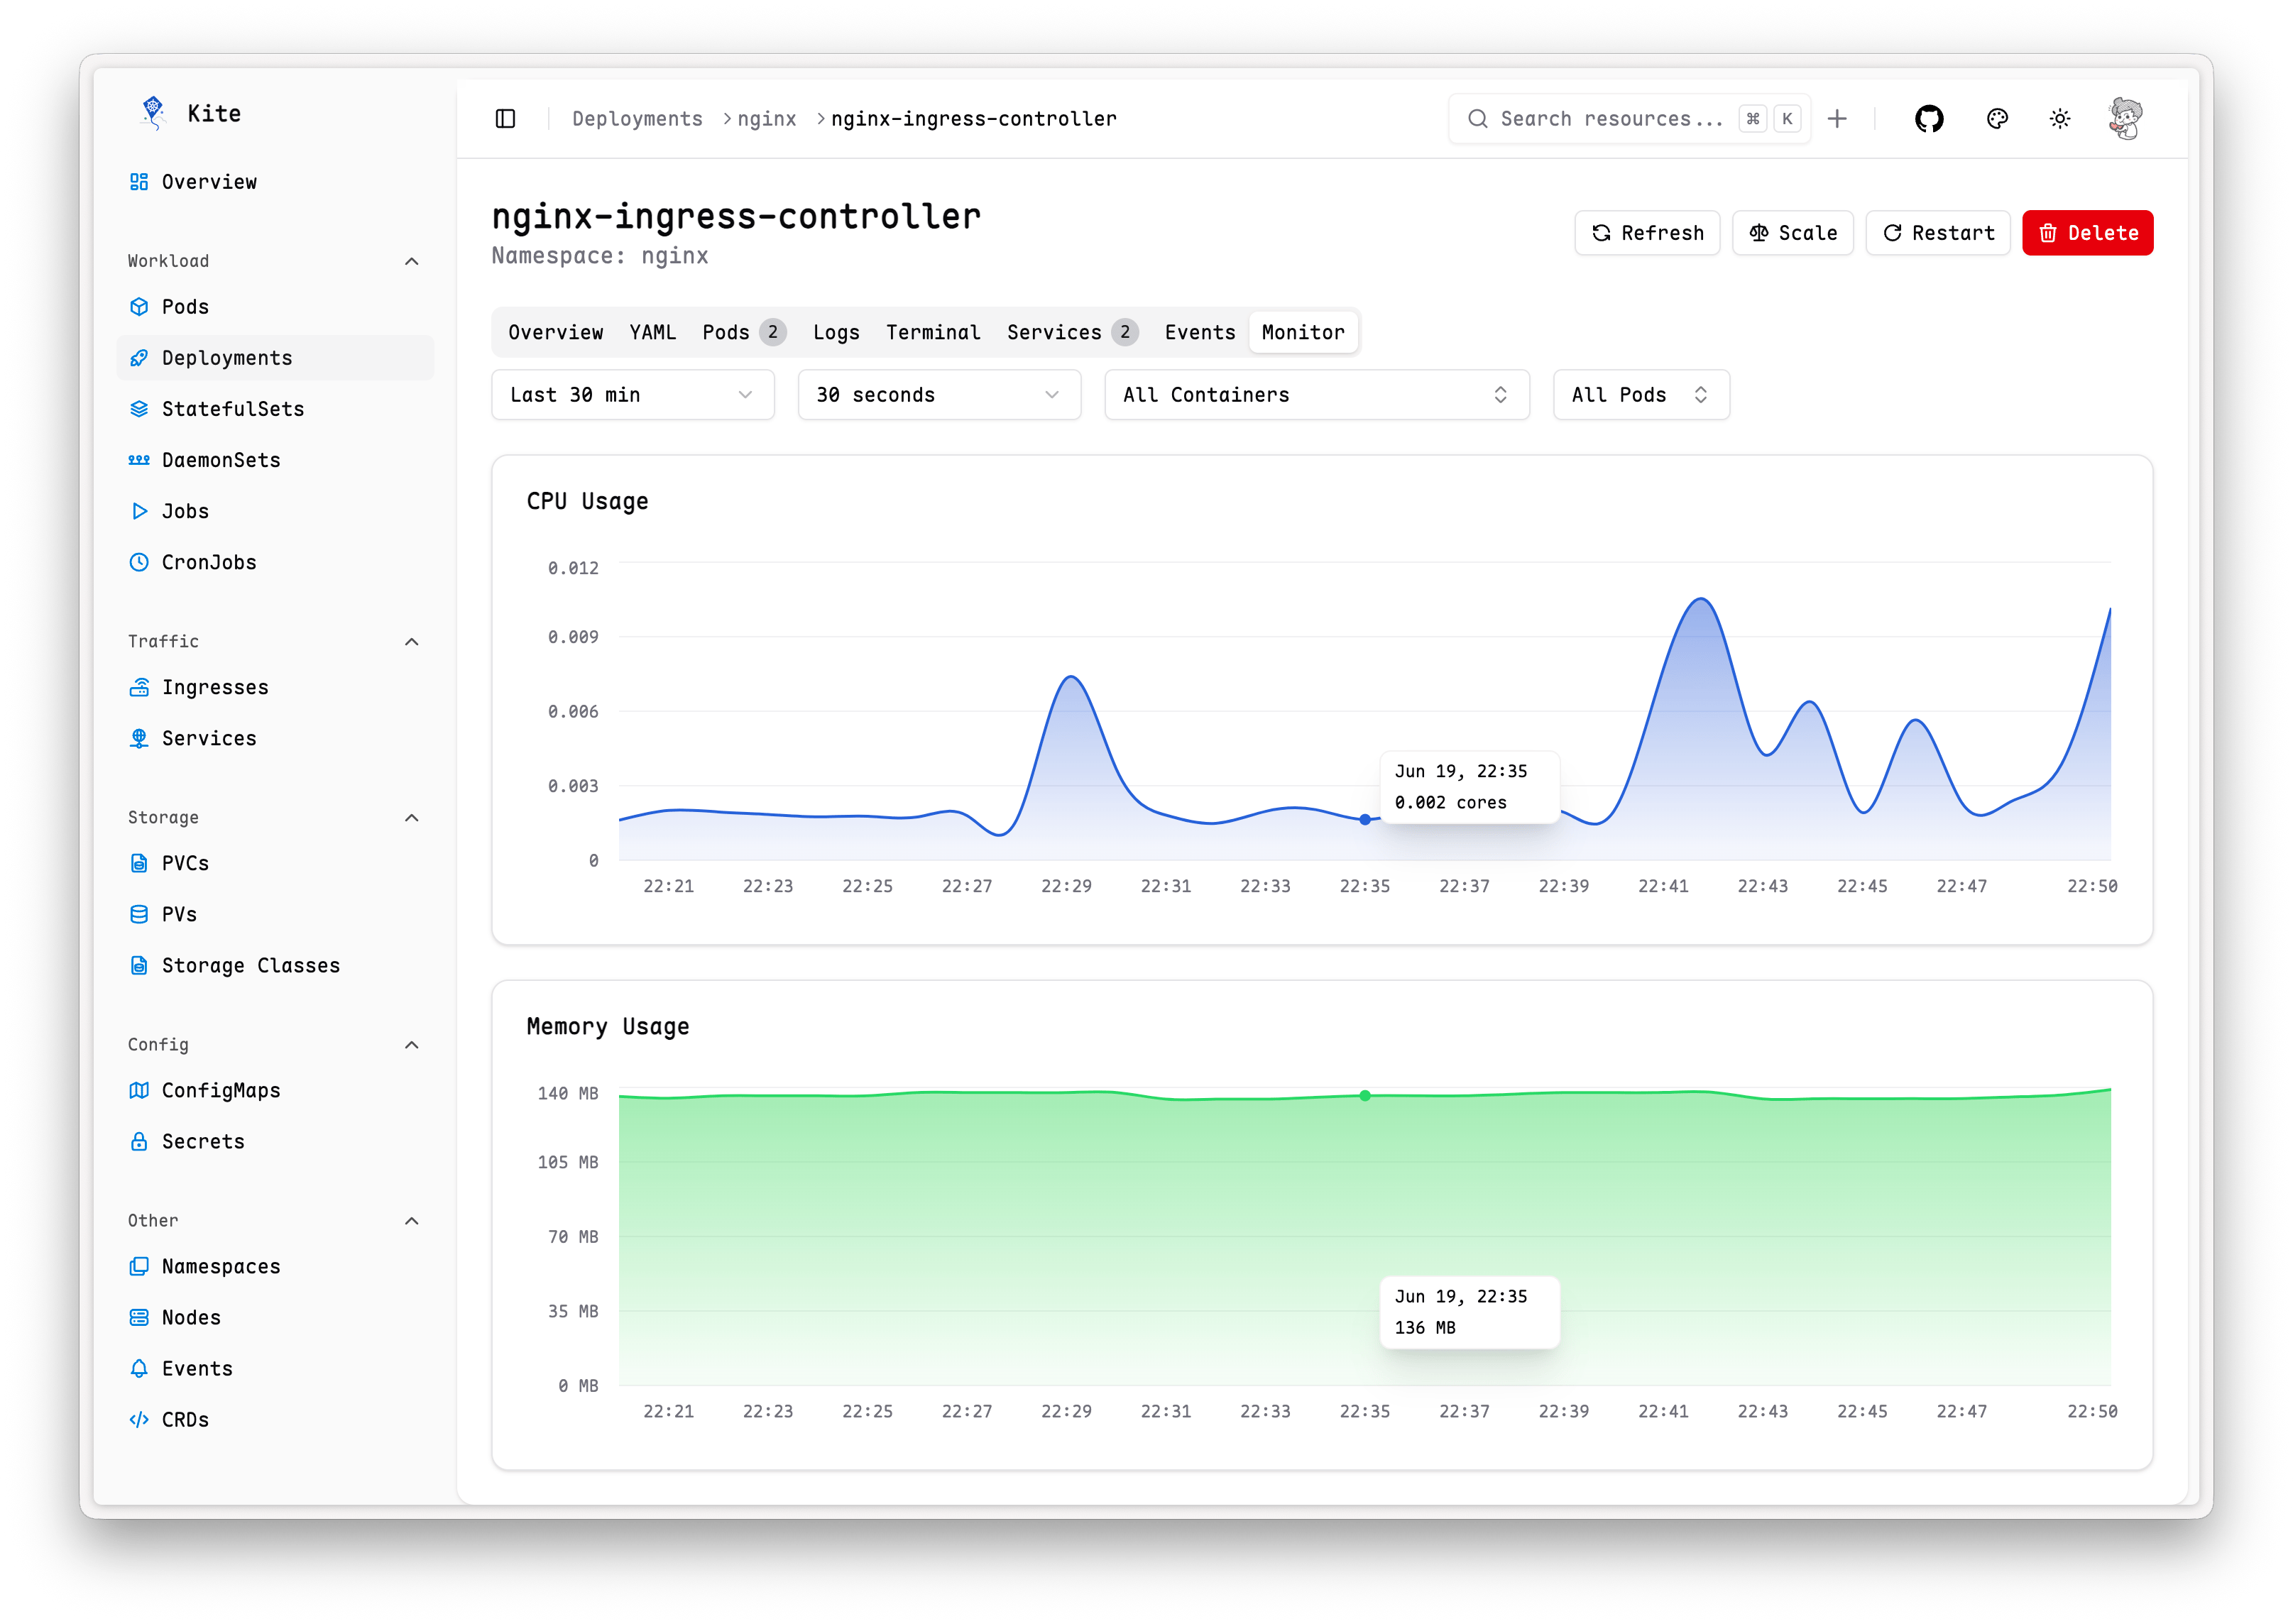
Monitor Tab
When viewing a supported resource, navigate to the Monitor tab to see:
- CPU Usage: Real-time CPU consumption of the pods associated with the resource.
- Memory Usage: Real-time memory usage of the pods.
This granular view helps in diagnosing performance bottlenecks and resource contention issues for specific workloads.
Prometheus Integration
To enable these rich monitoring features, Kube Sentinel must be connected to a Prometheus instance.
To learn how to configure Prometheus monitoring, please refer to the Prometheus Setup Guide.